
Financial Information _
INFORMES FINANCIEROS
Financial reports - Q1

Conferencia de Resultados 1T 2026.mp4
MP4 (13530) Kb
MP4 (13530) Kb
Financial reports - Q2
H1 Results Conference Call.mp4
MP4 (8957) Kb
MP4 (8957) Kb
Informes Financieros - FY

Presentación de Resultados Anuales 2025
Análisis de los resultados anuales 2025
Nota de Prensa FY2025
Cuentas Individuales Formato Oficial
Cuentas Anuales Consolidadas 2025
Memoria Individual
Conferencia de Resultados FY 2025
MP4 (15316) Kb
MP4 (15316) Kb
Cuentas Consolidadas (Formato Oficial)
Informe País por País público
Informes Financieros - FY
Presentación de Resultados Anuales 2024
Análisis de los resultados anuales 2024
Nota de Prensa FY2024
Cuentas Individuales Formato Oficial
Cuentas consolidadas formato oficial
Conferencia de Resultados FY 2024
MP4 (11466) Kb
MP4 (11466) Kb
Cuentas Anuales Consolidadas 2024
Cuentas Anuales Individuales 2024
Informes Financieros - FY
Presentación de Resultados Anuales 2023
Análisis de los resultados anuales 2023
Nota de prensa FY2023
Cuentas Anuales Consolidadas 2023
Cuentas Anuales Individuales 2023
Cuentas Consolidadas Formato Oficial
Cuentas Individuales Formato Oficial
Conferencia de Resultados FY 2023
MP4 (13820) Kb
MP4 (13820) Kb
Informes Financieros - FY
Nota de prensa FY2022
Cuentas Anuales Consolidadas 2022
Presentación de Resultados Anuales 2022
Cuentas Anuales Individuales 2022
Conferencia de Resultados FY 2022
MP3 (11780) Kb
MP3 (11780) Kb
Cuentas Consolidadas (Formato Oficial)
Memoria Individual (Formato Oficial)
Memoria Individual (Formato Oficial)
Cuentas Consolidadas (Formato Oficial)
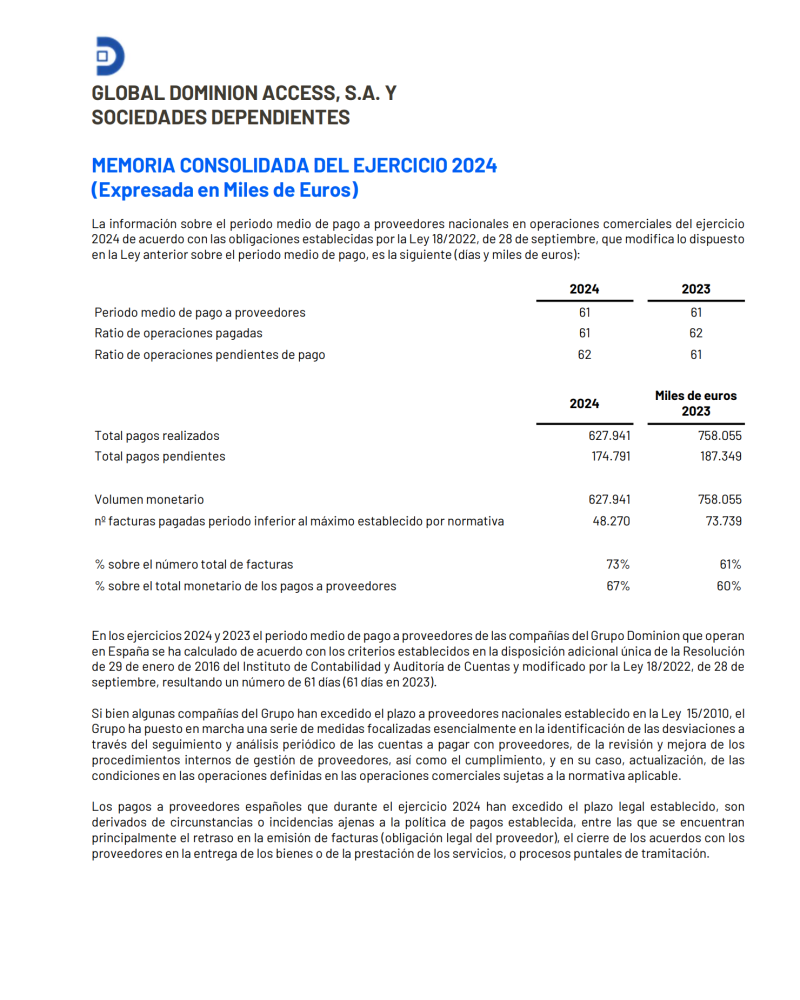
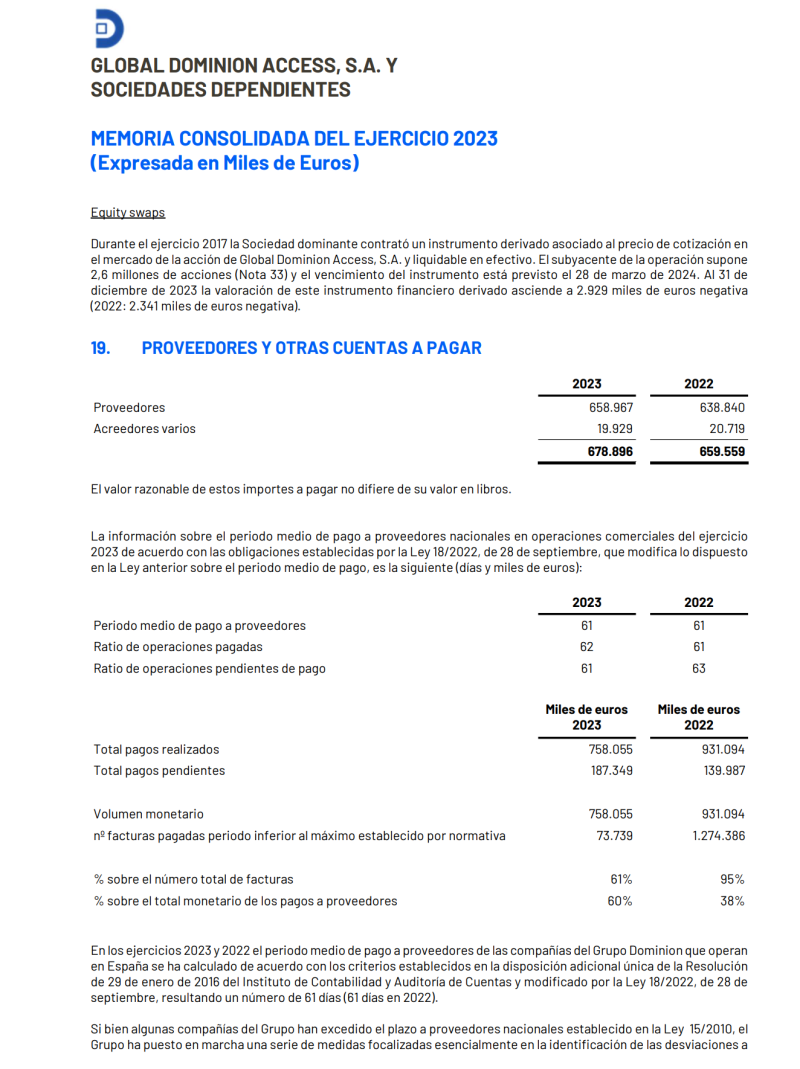
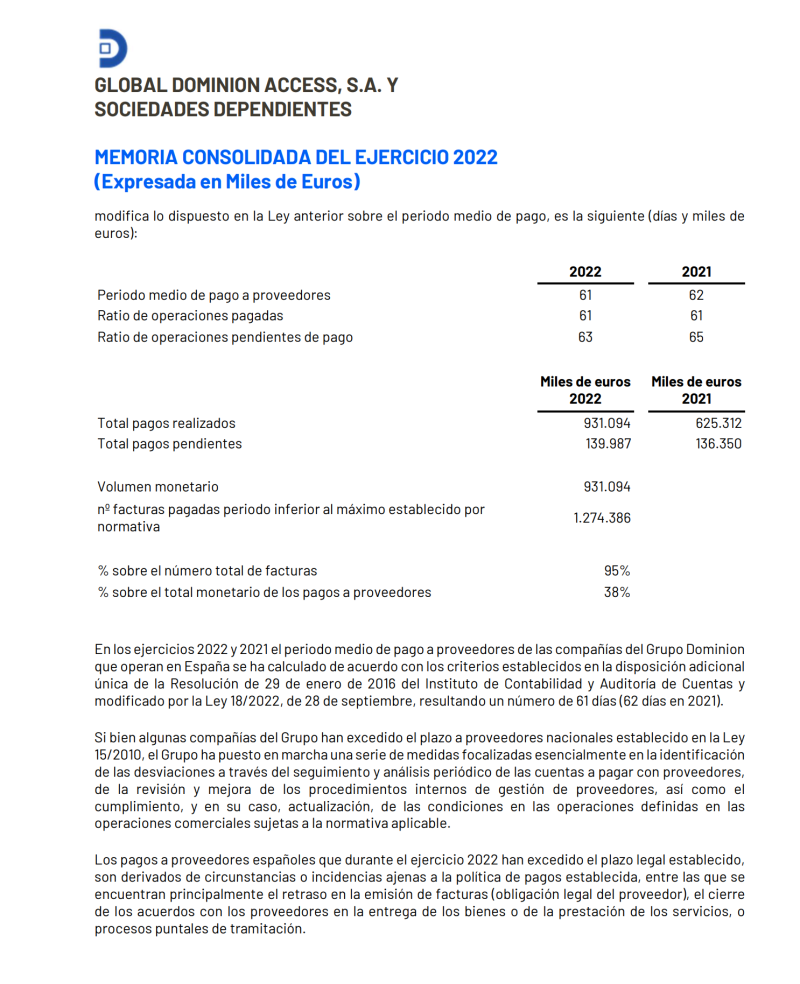
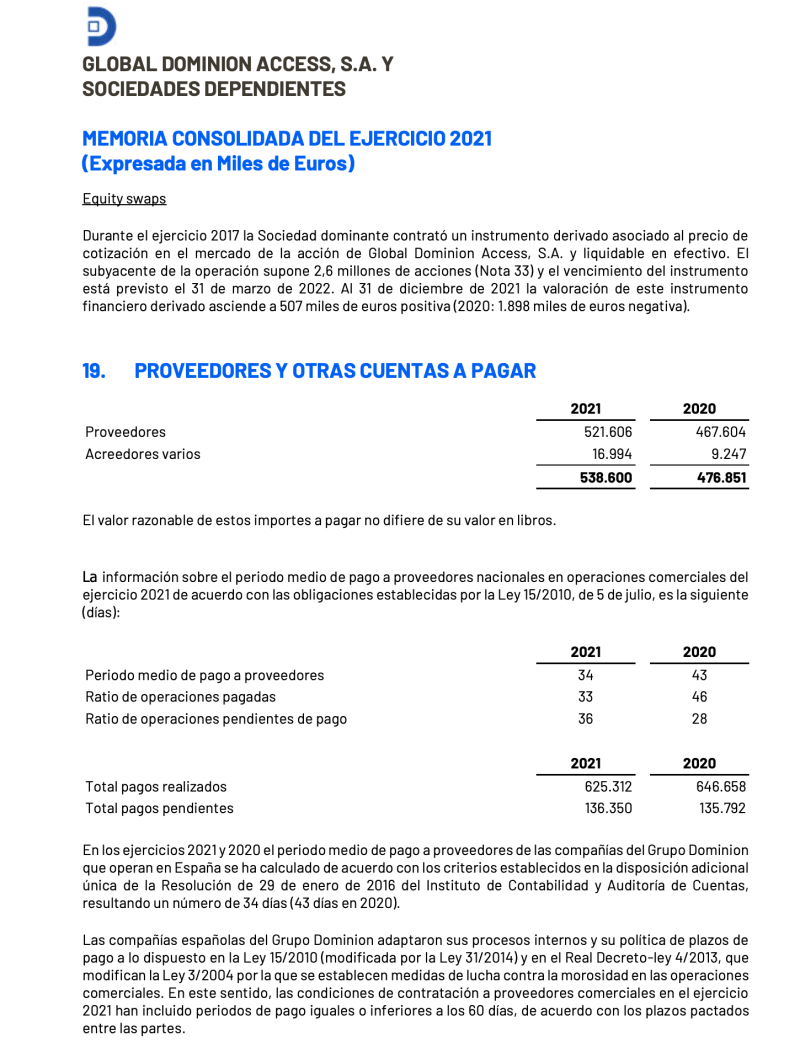
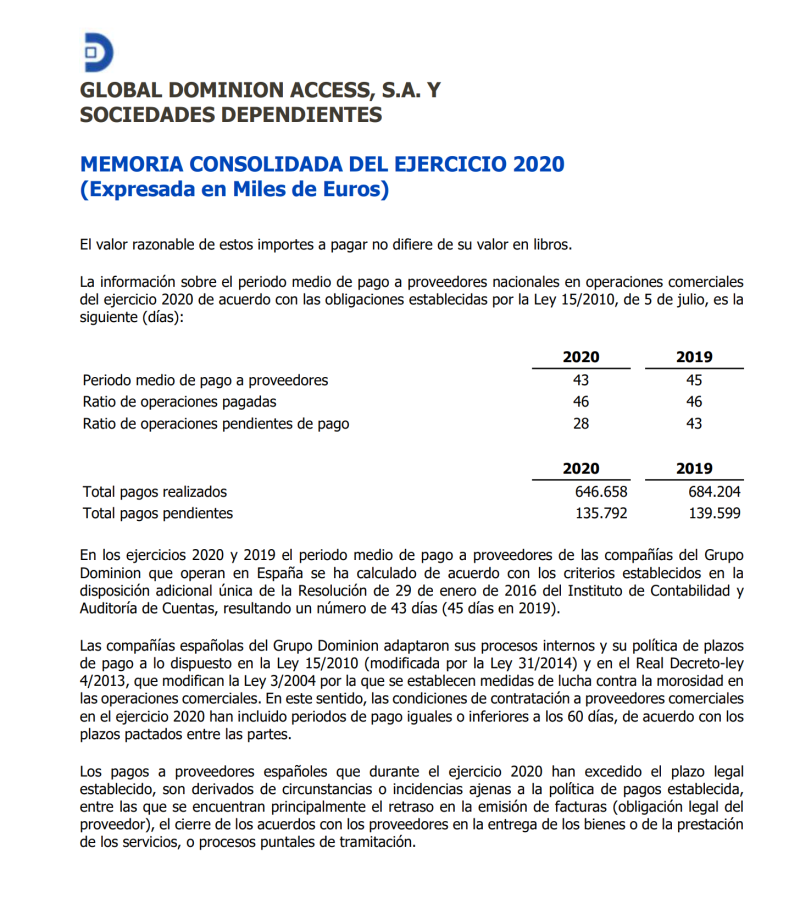
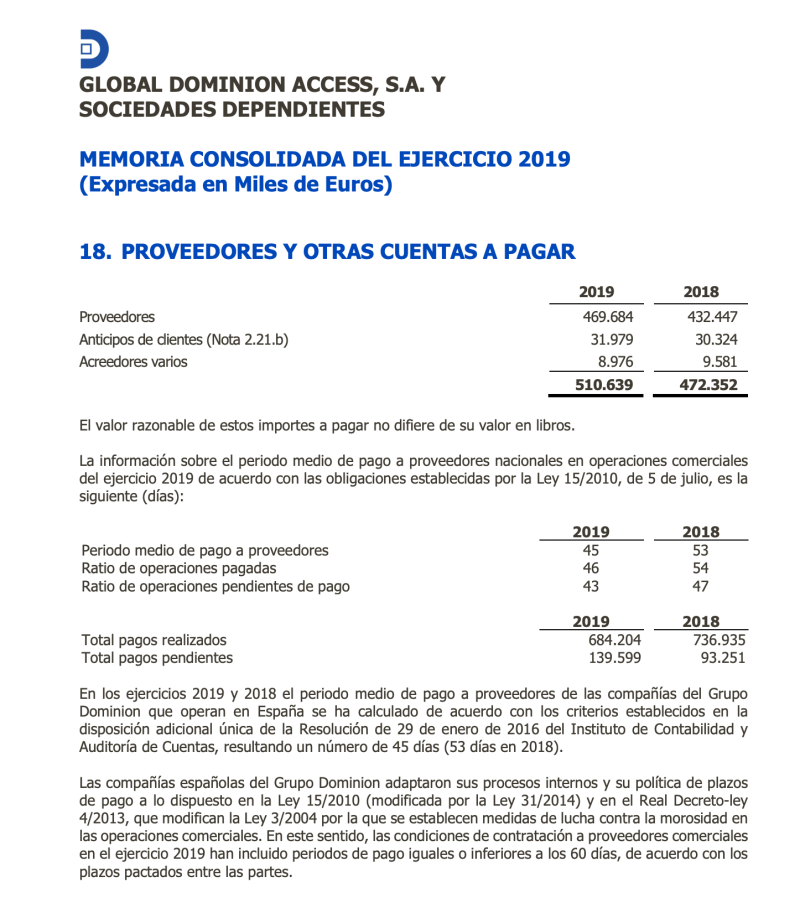
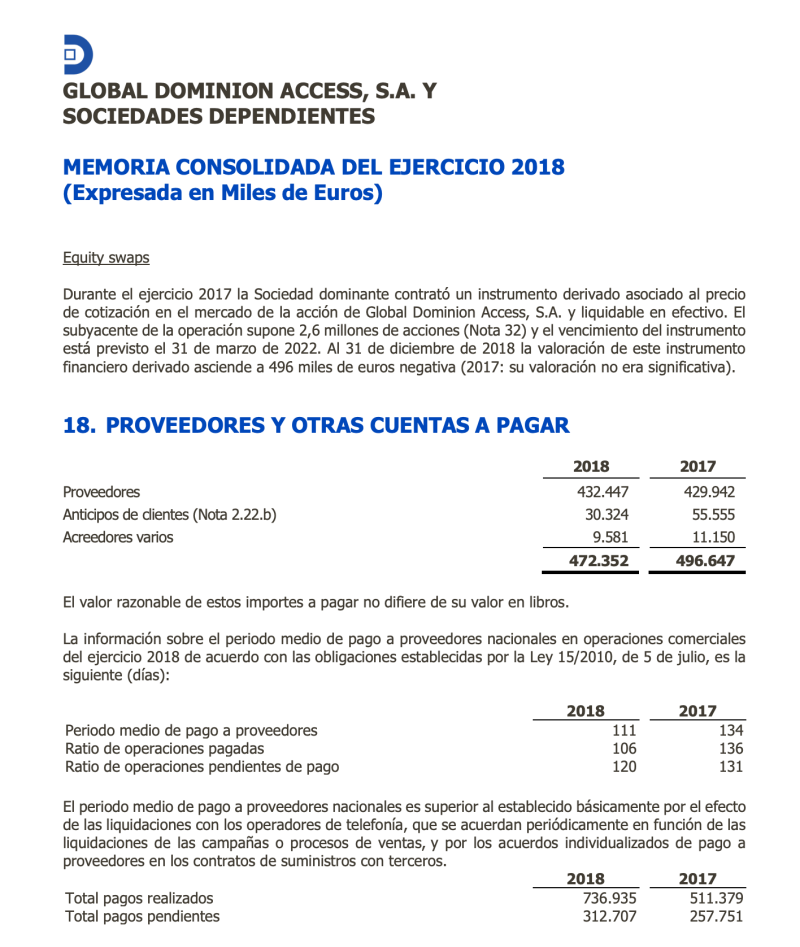
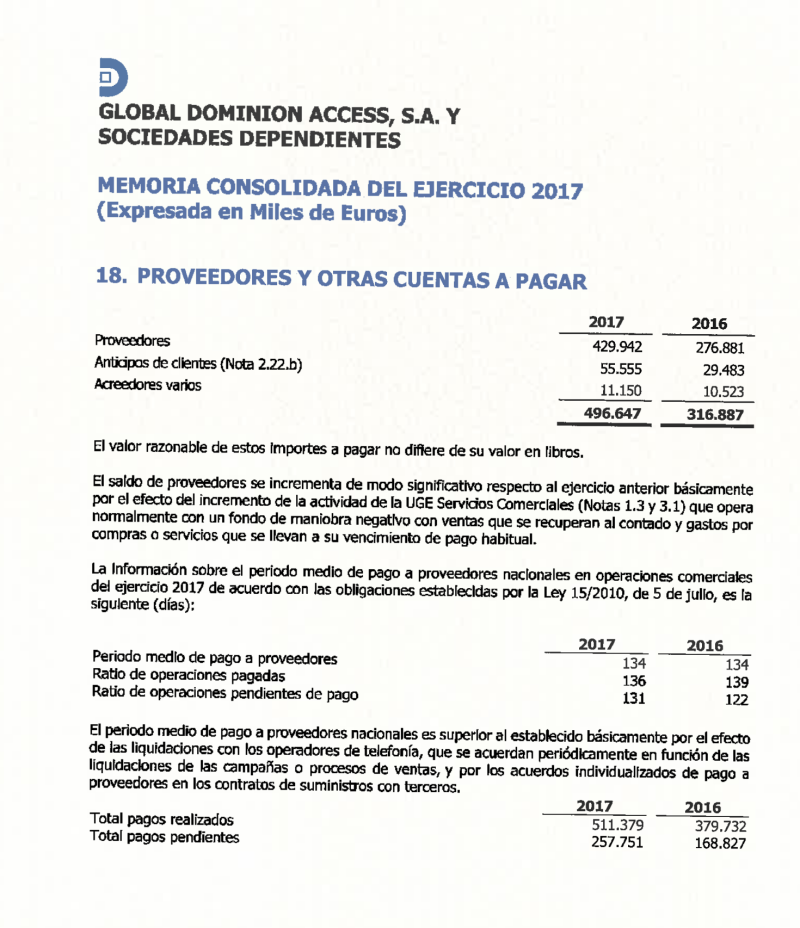
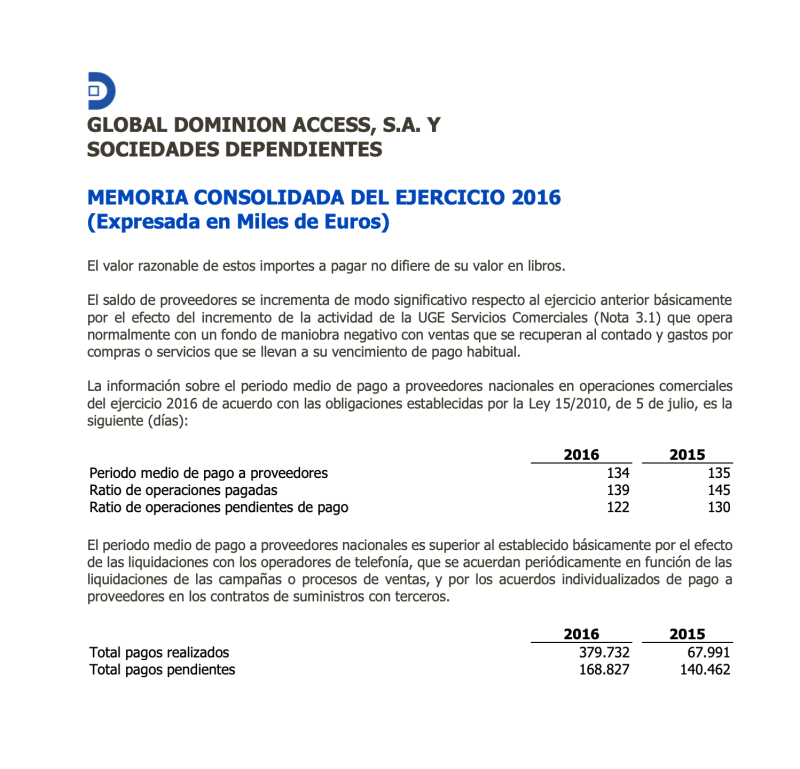
Average payment period to suppliers
Suppliers are a fundamental piece for the quality of our services and projects. That is why we try to adjust to their legitimate expectations: optimal price, fair payment terms and alliances that allow us to share innovation efforts.
2024: 61 days
We are here to help you with your project
Contact us and we will start increasing your company's efficiency through innovation.
